
From data to beautiful graphs: The tools of a modern scientist
About the author
Mg. Phys. Kristaps Bergfelds is a researcher at the Institute of Numerical Modelling (University of Latvia), where his daily duties include acquisition, processing, and plotting of scientific data. Additional to his research, Kristaps teaches programming for physics students (programming and data science basics using Python language). This article is based on Kristaps’ experience and observation on the daily computer tasks of his colleagues and students.

Introduction
Modern science is unimaginable without the use of a computer! However, much more than web-browsing, e-mail, and text editing is meant by this claim. Today’s IT environment and its rapid development require technology professionals and scientists to be familiar with data processing techniques, data visualization, and many other areas. The computer is the permanent ally of the scientist – the Swiss Army knife, which must always be kept sharp in your pocket!
But unlike a knife, a computer has no tangible blades or tools. Instead, these various functions are performed by applications installed on your computer. Knowing exactly which programs will be useful in a scientist’s daily life is often a long and painful search process. This article tries to help with this problem.
The article describes a list of free software that will be useful for anyone facing data processing problems and other typical tasks of a scientist. This article is intended for a beginner who uses the Windows operating system. However, it should be noted that some of the software is also available in the Linux environment.
This article is written as supplementary material for the Association of Latvian Young Scientists online event “Scientist’s Survival Kit: From Data to a Proper Graphic” on January 6, 2021. Event recording available on YouTube (in Latvian).
Management of files and raw data
Before you start the data analysis, you need to do several preparations, as well as answer a series of questions: What is the filetype of the data? What is the structure of these files? How many of these data files are there? How can you arrange and prepare them to proceed with your analysis effectively? Clarifying these issues often takes up most of the workflow and often is a source of many mistakes. The software listed in this section facilitates this stage of work.
Notepad++
You can use Notepad++ to view the contents of text files. This is especially important as it is a typical data storage format (.csv, .dat, etc. – these are all plain text data formats). You can also view these files with Windows tool Notepad, but as the name Notepad++ implies, this program offers several benefits.
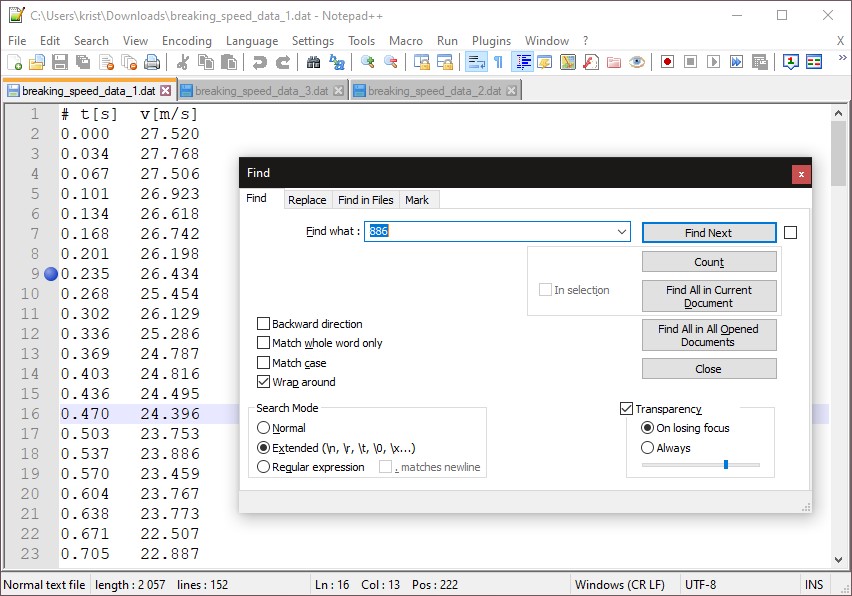
The program provides tabbed browsing, advanced find/replace operations (see figure), non-standard input methods (e.g., to write in several lines at once), the ability to turn on invisible characters, compare the contents of two files, syntax highlighting for numerous programming languages, etc. The possibilities and use-cases of this lightweight program are extremely wide.
Total Commander
When you need to work with many files and various filetypes, Windows built-in file manager Windows Manager may not have enough capabilities, but Total Commander certainly does.
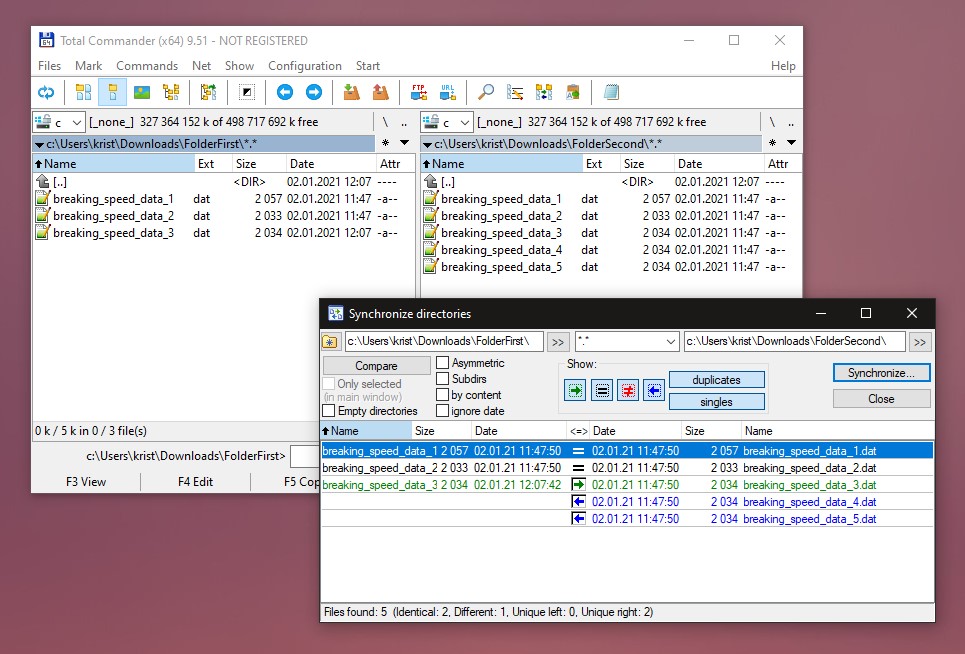
This program offers various specialized operations for file management: Bulk file renaming (with text find/replace and numbering), comparison and synchronization of file folders (see picture), specialized file search options, etc.
7-Zip
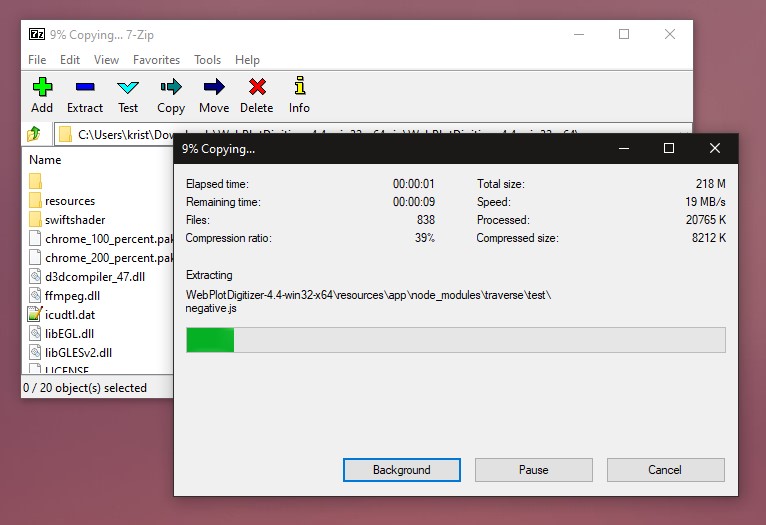
When finishing work on a project/data processing task, it is recommended to store the whole set of files (data, plotting scripts, generated images) compressed in a single ZIP archive file. This operation is important and relevant even though the capacity of modern data storage devices (flash drives, hard drives) has increased considerably in recent years.
Archive file creation is recommended not because of the storage size reduction, but instead for more convenient file management. Combining many small files into a single ZIP file makes several operations incomparably faster: such as copying files and synchronizing folders (shown above with Total Commander). Additionally, when you use archived data, you avoid the risk of the operating system performing unwanted actions (for example, Windows Photos application interpreting plotted data images like photographs and including them in albums).
The recommended software for working with various data archive formats is 7-Zip. It can create and open various types of archive files (.zip, .rar, .tar, .7z, etc.). It should be emphasized that, despite the support for various formats, it is recommended to create archives as .zip files, as it is an ISO standardized file format.
SpaceSniffer
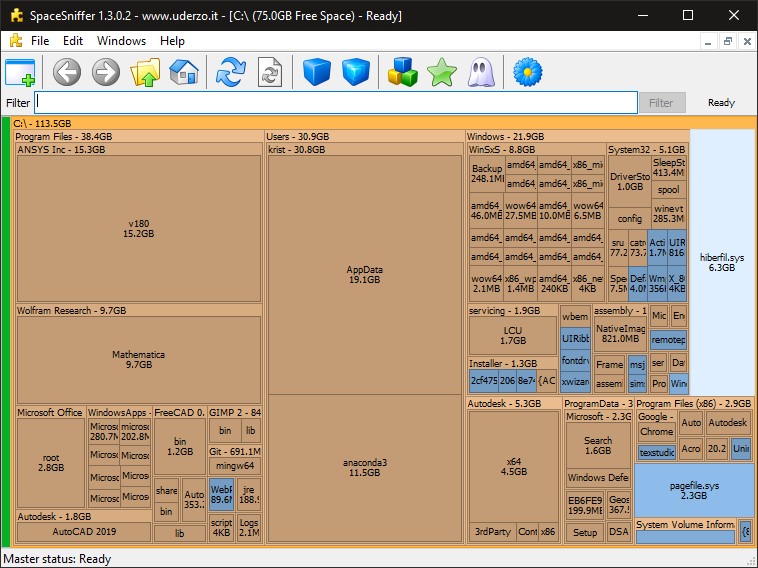
You can visualize the use of your storage device with SpaceSniffer. The program displays folders and files in the form of rectangles, the area of which is proportional to the amount of data in it. As you can see in the figure below, the contents of my C: drive are largely used by some very large programs (ANSYS, Wolfram Mathematica, Anaconda Python) rather than Windows files or my personal data.
Working with images and video
A large and important part of scientific work often is the creation and management of images. Very often photographs and other types of images are the data sources for scientific data analysis. Or vice versa – they are the main result of data processing operations. There are several tools recommended for working with this type of data that can facilitate this process.
WebPlotDigitizer
Sometimes it is necessary to get numerical data from an image. For example, data from old scientific publication must be used in your calculations or be redrawn. Instead of placing a ruler on the monitor, it is recommended to use WebPlotDigitizer for this task.
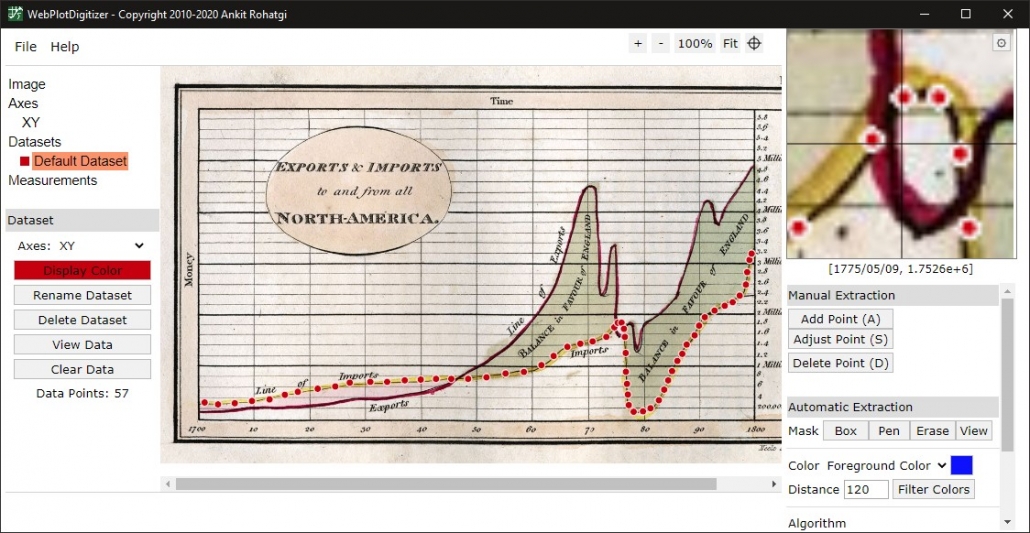
With the help of this program, you can read numerical data from any image – define your own reference system and, using the mouse cursor, read the data and save it in a data file (see the picture above). If the data is displayed with a contrasting colour, the reading can be done automatically without selecting the data points with mouse clicks.
GIMP
Image processing program GIMP is extremely popular – its capabilities are not that far behind commercial alternatives such as Adobe PhotoShop. It is possible to work with raster (pixel) images in layers, create effect layers and layer masks. Various filters and tools are available. The figure below shows the use of a relatively rare and unique tool: layer perspective correction to show what the logo would look like on a hallway wall as a signboard.
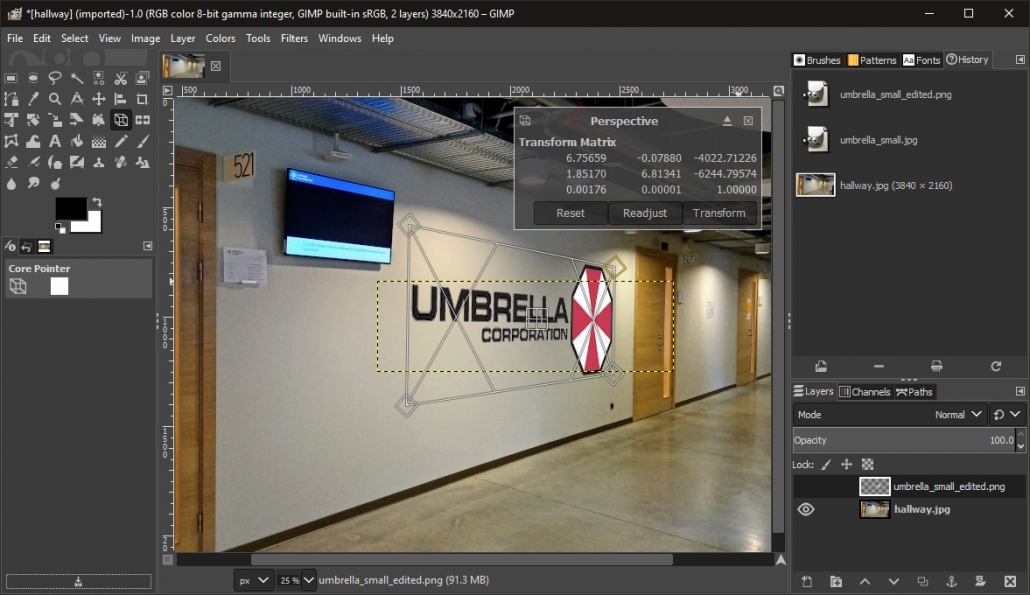
However, it should be noted that learning the program takes time and patience. However, if you do not need all the extensive features of GIMP, other simpler programs exist.
Paint.NET
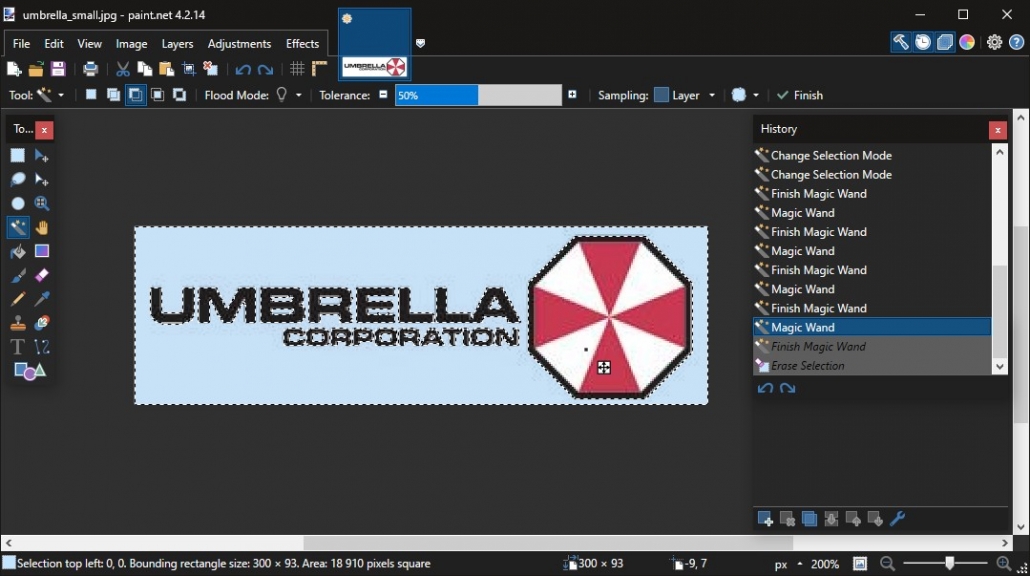
In case you do not need all the features of GIMP, Paint.NET is highly recommended. This relatively simple and intuitive program allows you to work with image layers, various effects and tools. For example, the image below shows how to use the Magic Wand tool to selectively highlight a white background for a logotype – for deletion or recolouring.
ImageMagick
In the case of many images, even simple operations such as resizing or converting the image filetype are not easy with the programs listed above. In such cases, ImageMagick can help. It is a command line program that allows efficient batch image processing. For example, the command below (executed in the Command Prompt console or written in a Windows batch script) will process all the JPG files in the folder – crops the biggest available square part of the image and resizes it to 1000×1000 px.
magick mogrify -gravity center -crop 1:1 +repage -resize 1000x1000 *.jpgThis is a typical operation when preparing images for further use on web pages or data processing programs.
Inkscape
Unlike the raster (pixel) image processing programs described above, Inkscape is designed for creating and processing vector graphics. It can be used to create various diagrams and drawings. Inkscape in many cases allows to avoid use of specialized software (CAD software, Microsoft Visio, etc.). If creation of schematics and other vector graphics are not routine operations for you, Inkscape is a particularly attractive choice.
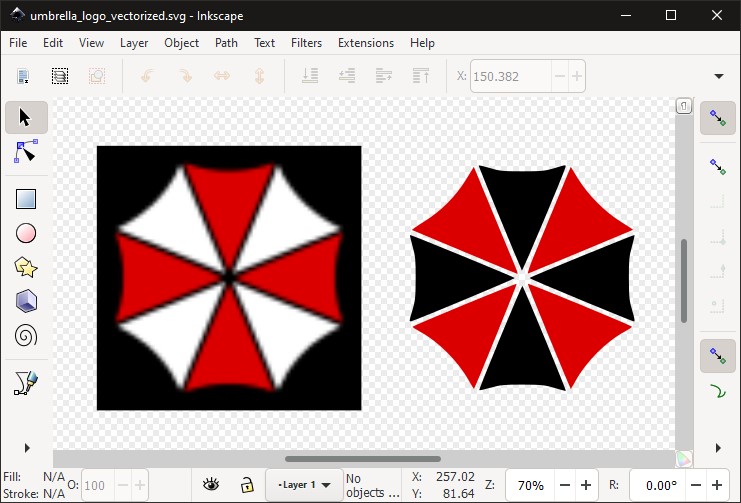
The image above shows both the capabilities of Inkscape and the benefits of vector graphics in general: A pixelated small image is transformed into a vector graphics object using the appropriate Inkscape tool Bitmap Trace. It can be resized while maintaining image quality. It is possible to change its colours and modify it many other ways.
Avidemux and OpenShot
Sometimes you must deal with situations where you need to work with video files – image frames need to be merged into a video (time-lapse), video file formats need to be converted, or a short video scene requires editing. However, buying commercial software (Adobe Premier, Final Cut Pro, etc.) might not be an option. In this case, free tools such as Avidemux and OpenShot will come in handy.
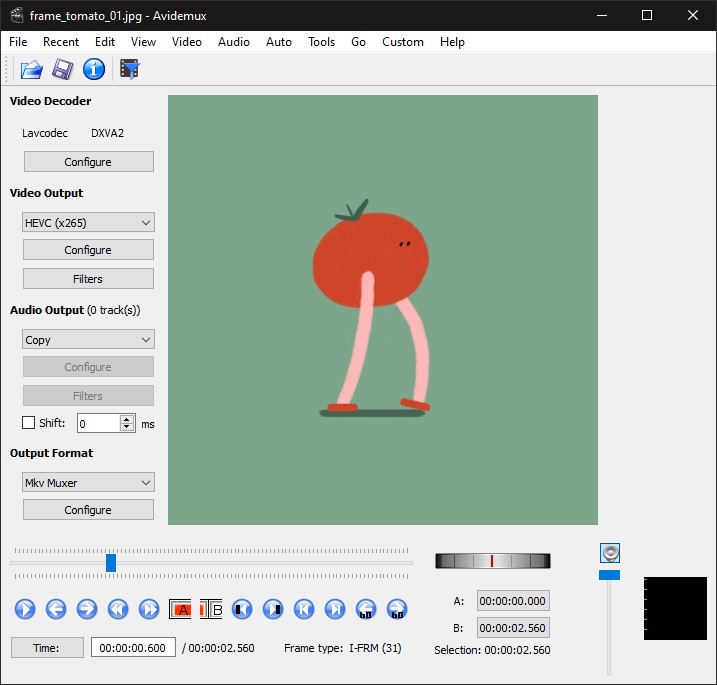
Avidemux is a very capable program for converting various video formats and changing the technical parameters of video files. It is also possible to combine individual images (.jpg, .png) into a video file (see example in the image above). OpenShot, on the other hand, is a very powerful video editing tool that goes beyond the Video Editor included in Windows 10. At the same time, the program is intuitive and simple enough to learn quickly.
Data visualization and creating reports
Once you have found out the structure of your data files and arranged them for easy processing (for example, they are named with a numbered pattern), you can begin processing and plotting them and summarize the results in a report. This section shows some tools and approaches for this process.
Gnuplot
If you only need to display (not process) data files, Gnuplot is very useful. This program can be used as a command-line application or used via plotting scripts. Because the program is intended for data plotting – not processing – the commands used are very concise and minimalistic. It is relatively easy to learn this program, while still allowing you to process very large data sets and obtain various types of output (line plots, bar plots, histograms, 2D heatmaps, etc.). You can output graphics in both vector (PDF) and raster (PNG) image formats.
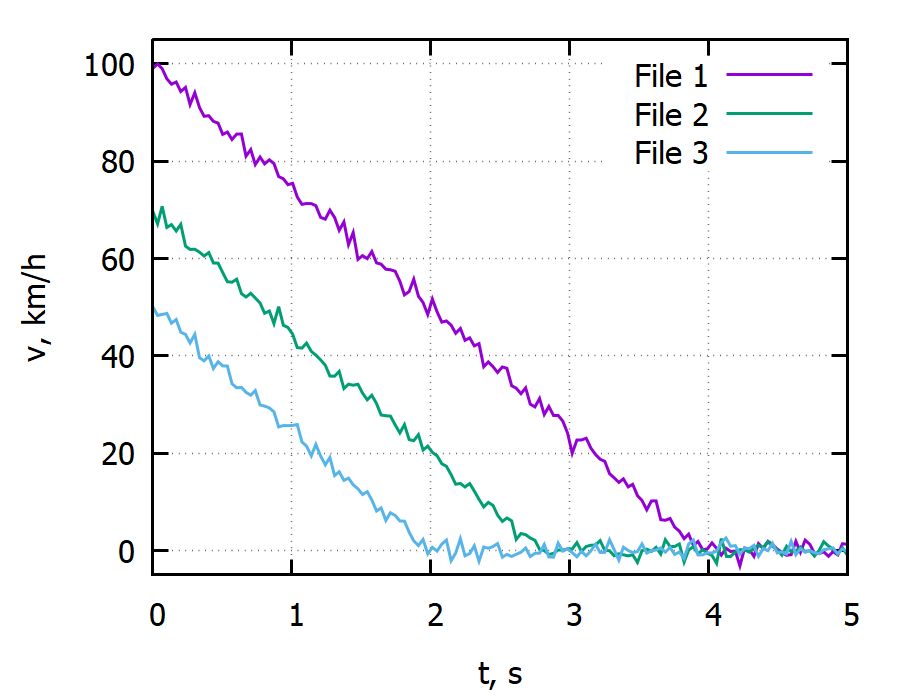
Below is a small script that plots the contents of three data files in a single image: speed versus time during car breaking and stopping. The comments within the script describe the meaning of each section of the code. Here you can download the whole example (input data, plotting script, output image).
# Defining canvas size, line thickness, and font size
set terminal pngcairo size 900,700 enhanced lw 3 fontscale 2.0

# Setting filename of the output
set output "example_gnuplot_output.png"

# Formatting plot (axis titles, range, tickmarks)
set yrange [-5:105]
set xlabel "t, s"
set ylabel "v, km/h" # Data in m/s! Need to scale by 3.6!
set xtics 1
set ytics 20
set grid

# Cycle for plotting all three datafiles on single canvas
plot for [i=1:3] \
	'breaking_speed_data_'.i.'.dat' using ($1):($2*3.6) with line title 'File '.i
The plot (see below) shows that the car has stopped from 100, 70 and 50 km/h within 4.0, 2.7 and 2.0 seconds respectively.
Python
If it is necessary not only to display the data, but also to process it at the same time, then the Python programming language and various additional components (packages) are very suitable for this purpose. A convenient way to get the full set of tools (Python, frequently used packages, graphical code editor) is to install the Anaconda software package.
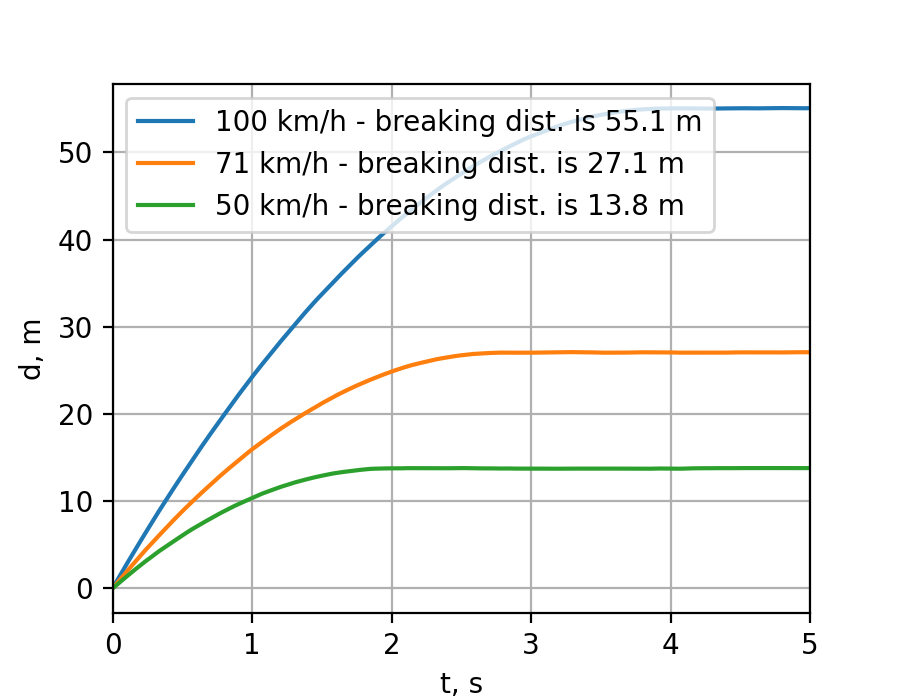
The capabilities of the Python programming language and related tools certainly go beyond the scope of this article, but below is an example of what a data processing and plotting script looks like. It uses Numpy/Scipy numerical data processing capabilities as well as Matplotlib plotting library. The comments within the script describe the meaning of each section of the code. Here you can download the whole example (input data, plotting script, output image).
# Importing necesarry packages
import numpy as np
import matplotlib.pyplot as plt
import glob
from scipy.integrate import cumtrapz

# Reading all filenames ending with '.dat' from the current folder
text_filenames = glob.glob("*.dat")

# Defining canvas size for plotting
plt.figure(figsize = (4.5,3.5), dpi = 200)

# Cycle through all filenames for data processing and plotting
for filename in text_filenames:

    # Reading each file (tab-delimited data)
    time, velocity = np.loadtxt(
        filename,
        delimiter = "\t",
        skiprows = 1,
        unpack = True
        )

    # Using numerical integration to get distance from velocity data
    distance = cumtrapz(velocity, time, initial=0.0)

    # Determining maximum velocity and distance (for later use in legend)
    velocity_max = velocity.max()
    distance_max = distance.max()

    # Plotting distance vs. time and putting the max distance in the legend
    plt.plot(
        time,
        distance,
        label = "{:.0f} km/h - breaking dist. is {:.1f} m".format(
            velocity_max*3.6,
            distance_max
            )
        )

# Formatting of the plot (added grid, axis titles, legend)
plt.grid()
plt.legend(loc="upper left")
plt.xlabel("t, s")
plt.ylabel("d, m")
plt.xlim(0,5)

# Saving the plot as PNG image
plt.savefig("example_python_output.png")
The script sums up (integrates) the previously displayed car velocity data to show the braking distance of the car. It can be seen that the car’s braking distance from 100 km/h is 55 m, but from 50 km/h only 14 m. This result is quite un-intuitive, as twice the speed does not mean twice the braking distance. In fact, it is four times greater!
LaTeX typesetting
Usually, the main result of a scientist’s work is not constructed equipment, programmed software or other production-grade product. Instead, it is new information and conclusions. The way you present the results of your research – this new information – is extremely important. It must thorough, technically sound, and easy to comprehend. Most of these informative materials (reports, publications, scientific articles) rely heavily on the use of figures, tables, mathematical expressions, bibliographic citations.
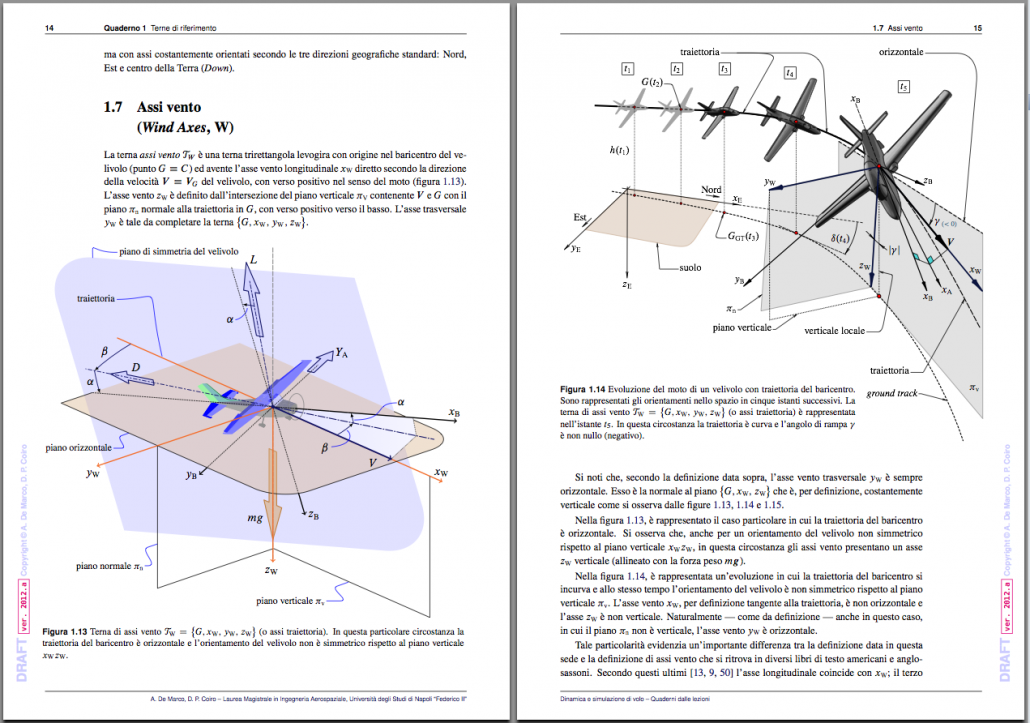
It is possible to create this type of material in Microsft Word, but it is certainly cumbersome. LaTeX typesetting solutions are much more suitable for this purpose. When using LaTeX, documents are created in the form of a code, specifying only the content – where the sections start and end, where to insert references, where to place images. The formatting is left to the LaTeX engine, which arranges text and images optimally, performs automatic reference numbering and so on. This approach is so suitable for creating scientific literature that scientific journals often accept articles only in LaTeX code. Below is a visual example of a LaTeX typesetting result that would be extremely difficult to create with Word (example from this StackExchange thread).
To start creating documents with LaTeX, you can install the necessary software on your computer: MiKTeX package (allows you to convert LaTeX code into a PDF document), as well as TeXstudio or Texmaker editor (GUI for easy code creation, file management). But lately, creating LaTeX documents on the Overleaf cloud platform has become extremely popular. There is no need to install anything on your computer – documents can be created directly in a web browser.
LaTeX document creation and language syntax are also too broad a topic for the scope of this article, but for an impression of how document creation with LaTeX/Overleaf works, see this example where comments show the meaning of each code section.
Conclusion
The list of recommended software as well as their capabilities is by no means fully described in this article. There are other open-source programs that perform the described functions. Additionally, the software shown here can be used for much more that is shown. Nevertheless, I hope that this article will serve as the first step for those looking for ways to expand their capabilities.
Appendix
Following the publication of this article, several readers have identified other valuable open access programs that are relevant to the topic of this article.
Voidtools – Fast file search;
FreeFileSync – file synchronization;
Engauge Digitizer – acquiring numerical data from images;
Shotcut – video editing;
Photopea – photo editing in web-browser;
Audacity – audio editing;
IrfanView and ImageGlass – fast image opening and browsing;
darktable – editing RAW photo files (alternative to Adobe Lightroom).